
VolaraID
See the Structure. See the Score.
Every Top Pick is frozen the night it's published — entry, stop, targets — then scored against what the market actually did, forever, in public. Wins and losses both shown, no cherry-picking. Underneath: automated Wyckoff phase detection, Smart Money structure, Relative Strength, Volume Profile, and a full IDX screener — the same analysis engine that produces those picks, available on every stock you analyze.
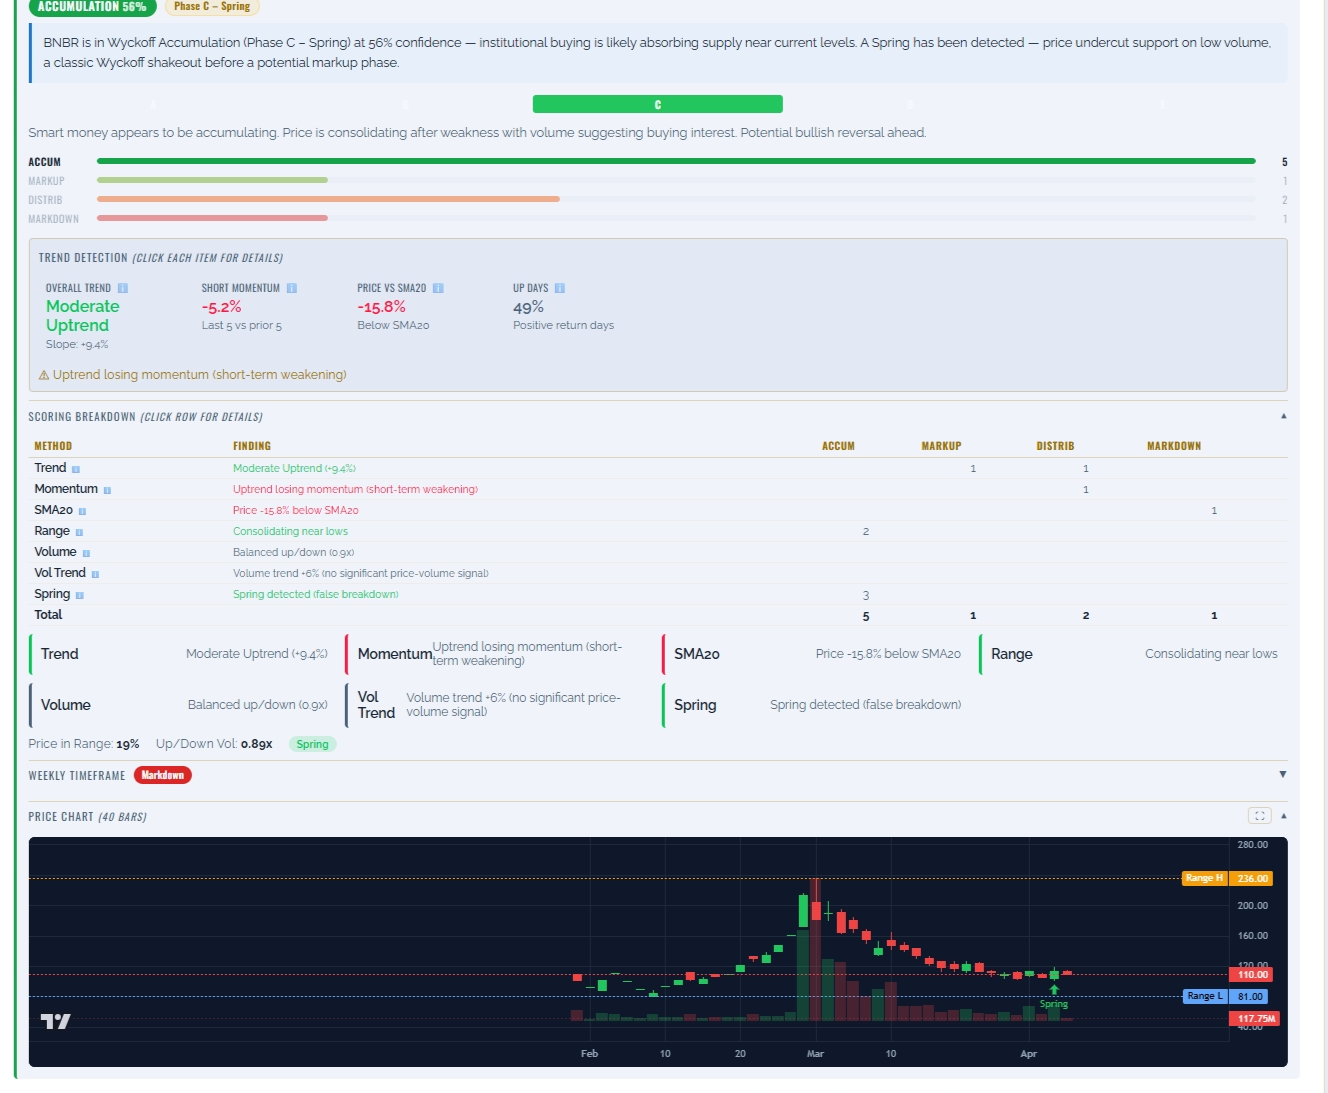
One example: BNBR flagged in Wyckoff Phase C (Spring) on 6 Apr 26. One pick proves nothing by itself — see every pick this engine has made, wins and losses alike, at /track-record.
✦ Our Best Features
How VolaraID Works
Enter Ticker
Masukkan Kode Saham
Type any IDX stock code or pick from your watchlist
AI Scans Structure
AI Menganalisis Struktur
Wyckoff + AMD + VP + etc. analyzed in seconds
Act on Signals
Ambil Keputusan
Clear phase label, score & trade insight
See your first signal in seconds
Start a 7-day free Pro trial — no card required, cancel anytime.
Explore every Pro feature with ~1-month-old data — read-only, in your browser.
What You Get
Technical Analysis & Fundamental Analysis
Technical Analysis (RSI, MACD, EMA, Bollinger Bands, Volume profiling, and trend scoring across multiple timeframes) & Fundamental Analysis (P/E, P/B, ROE, Revenue Growth, Debt-to-Equity — fundamental health scored and normalized).
Buying Pressure Detector
A daily market-wide board of the stocks on unusual buying volume, ranked by relative volume with today's traded rupiah value overlaid — so real institutional buying stands apart from thin-stock retail churn.
Other Advanced Analysis
Wyckoff phase detection, AMD cycle analysis (Accumulation, Manipulation, Distribution), Volume Profile (POC, VAH/VAL), multi-timeframe Initial Balance (daily/weekly/monthly opening range), Anchored & Rolling VWAP (institutional fair value — fixed-anchor plus a trailing 1M/3M/1Y band), Price Line Statistics (MA20/50 & Quarterly/Yearly VWAP with a 0–100 Mean Reversion Score), and Relative Strength (IBD-style RS Rating 1–99 + RS Line vs IHSG) — institutional-grade market structure analysis. Save any stock as a one-click Trade Sheet image — a shareable card whose price ladder stacks entry, stop, targets, POC/VAH/VAL, untested order blocks and high-volume nodes into a single sorted column with the live price pinned in place, beside a pass/fail technical checklist, RS Rating, and the Volatility Pack. Every one of these also plots directly on View Chart — 27 toggleable indicators on one chart (7 types), including a 9/21 EMA Cloud that recomputes on whichever timeframe you’re viewing, quarterly Revenue Growth markers placed on the day results were announced, five Smart Money overlays (Fair Value Gaps, Order Blocks, Premium/Discount zones, Liquidity Pools, BOS/CHoCH) and the full Volume Profile distribution as a histogram, with RSI and MACD read out in the header.
Watchlist Management
Save, organize, and analyze custom stock groups. Multiple watchlists with persistent local storage. Each watchlist's Signal Board reads off every ticker's already-computed nightly data in one glance — Rating & Score, Wyckoff phase, RS Rating, Manipulation Risk, TD Sequential exhaustion, and Top Picks membership — no new analysis required.
Refer & Earn
Share your personal referral link. When a friend you invite makes their first purchase, you both get 30 extra days of Pro — up to 10 rewarded referrals per rolling 30-day period.
Stock Prediction
Ensemble signal voting across Wyckoff, RSI/MACD divergences, and supply-demand zones — outputs direction, confidence %, and full trade setup with Stop Loss & Take Profit levels.
Smart Money Screener
Scan 800+ IDX stocks daily, each ranked with a 0–100 Conviction Score. Multi-select filters (Wyckoff phase, rating, sector, VP position), a Max Pump Risk safety floor, Top-N shortlists, a signal-confluence strictness control, and self-describing, quality-screened presets (hover or ⓘ to read exactly what each one screens for) surface fewer, higher-confidence setups — including new Resistance Breakout (swing high / SMA50 / 1Y VWAP / gap) and Fresh Demand Zone (bullish Order Block / Fair Value Gap) scans. Every preset's real-world performance is now tracked with a forward (out-of-sample) test — logged the moment it fires and followed forward, never recomputed after the fact.
Market Insight
Daily market insights (Foreign Flow, Daily Brief) and weekly summaries (Sector Rotation, Market Highlights with 19 categories — Free). Daily Brief now leads with a bilingual Macro & Commodities Pulse note (oil, rupiah, nickel/coal/CPO, Bank Indonesia policy) alongside its Wyckoff/smart-money narrative. Market Highlights covers weekly top gainers/losers, unusual volume, smart money signals, sector leaders, near-breakout setups, and more. A free Corporate Actions calendar and Dividends view (yield, ex-dates, KSEI-synced) round out the daily/weekly feeds. Pro members get Top Accumulator Foreign Flow, per-ticker Foreign Flow Divergence (stealth accumulation & distribution alerts), the Market Breadth & Regime dashboard (advance/decline internals, McClellan momentum, Risk On/Off regime), and Today's Top Picks — top 5 algorithmic trade candidates with entry/exit levels.
Financial Report Intelligence
Upload any OJK quarterly or annual PDF (up to 200 pages, 5 reports/day for Pro) and receive a structured analysis — typically 30–60 seconds for text PDFs, up to ~10 minutes when scanned/image pages require OCR. Output: YoY growth, balance-sheet ratios, cash-flow quality, 30+ risk flags, and the Analytics Pack — Piotroski F-Score, Altman Z'', DuPont + common-size, and peer-relative ratios. Supports scanned PDFs via automatic OCR fallback, USD-reporting issuers, and bilingual OJK templates with automatic column detection. uploaded PDFs are deleted immediately after extraction.
Chart & Candlestick Pattern Recognition
Algorithmic detection of 13 classic chart patterns (Cup with Handle, Double Top/Bottom, Head & Shoulders, Triangles, Flags, Wedges, Rounding Bottom) and 20 candlestick patterns (Hammer, Engulfing, Morning/Evening Star, Doji variants, Three Soldiers/Crows) — each with a confidence score, target price, and stop-loss level.
Stock Comparison
Compare 2–4 IDX stocks side-by-side across 31 metrics — Wyckoff phase alignment, daily/weekly confluence, rating, fundamentals (P/E, P/B, ROE, D/E), returns, foreign flow, manipulation risk, AMD zone, SMC signals, and Sequential Exhaustion (9-13) — plus a 60-day and 1-year return correlation matrix, a diversification sanity-check computed from daily price history. Winner highlighting and saved comparison sets. Pro only.
Top Picks — Daily Trade Candidates
Up to 5 algorithmic trade candidates published every day, ranked by a 100-point multi-factor model (Wyckoff phase, volume confirmation, technical confluence, relative strength, risk/reward). Each pick ships with an entry, stop-loss, two profit targets, and a setup type (8 archetypes) with a suggested hold duration — risk-adjusted for volatility and capped at 2 per sector. Pro only.
Shareable Analysis Cards
One click turns an Analyze summary, Top Pick, or Market Breadth snapshot into a branded image — ready to post on Twitter, Telegram, or Stockbit Stream. Available wherever the underlying content is visible, on every tier.
Customizable Analyze Desk
Every Analyze subtab is a drag-and-drop desk — reorder sections, hide the ones you don't use, and switch between 1/2/3-column layouts. Saved to your account and synced across devices. Pro only.
Ready to trade with structure, not guesswork?
Unlock the Smart Money Screener, Top Picks, and the full analysis suite free for 7 days.
Feature Deep Dive
Stock Prediction
Ensemble signal voting for directional conviction
Combines multiple technical signals into a single directional forecast. The system votes across Wyckoff phase, RSI and MACD divergences, supply & demand zones, and trend alignment — assigning weighted points to each signal — to determine Bullish, Bearish, or Neutral direction with a confidence score. Outputs a complete trade setup with entry zone, Stop Loss, Take Profit 1 & 2 derived from ATR and key support/resistance levels.
Top Picks
Daily algorithmic trade candidates — scored, ranked, risk-adjusted
Every trading day, VolaraID scans the entire IDX universe and surfaces up to 5 of the highest-probability trade candidates — so you don't have to screen hundreds of tickers yourself. A 100-point model scores each name across five factors: Wyckoff phase alignment, volume confirmation, technical confluence, relative strength versus IHSG, and risk/reward setup. Every pick comes with a concrete entry, stop-loss, and two profit targets (minimum 1.5:1 R/R), a setup type drawn from 8 archetypes (Spring Breakout, SOS Confirmation, Absorption Reversal, and more) with a suggested hold duration, and a plain-language reason it made the list. A Monte Carlo simulation turns those static levels into odds — the chance of tagging each target or the stop first, an expected R-multiple, and a worst-case 5th-percentile return over the 20-day hold. High manipulation-risk and thin, illiquid names are excluded, scores are penalised for excess volatility, and no more than 2 picks come from any single sector. Available on the Research → Insights tab. Pro only.
Top Picks Track Record
The verified, public forward record — wins and losses, no cherry-picking
Every Top Pick is frozen the night it's published — entry, targets, stop — and never recomputed or removed retroactively. The public Track Record page shows the complete forward result: win rate, profit factor, monthly and per-setup breakdowns, and the 20 most recently resolved picks — wins and losses both shown. The equity curve is a genuine capital-constrained portfolio replay of every resolved pick — one position per ticker, a real cash constraint, equal-weight sizing — reporting maximum drawdown and returns net and gross of an estimated round-trip cost, benchmarked against IHSG buy-and-hold over the identical period. No login required. Pro subscribers get an inline drill-down into the full pick-by-pick history with levels, score factors, and Monte Carlo probability snapshots.
Wyckoff Analysis
Market cycle phase detection
Identifies the current market phase using Wyckoff's cycle theory. Analyzes trend, consolidation, volume character, and key events — Spring (false breakdown signaling smart money accumulation) and Upthrust (false breakout signaling distribution) — to determine where price is in the Accumulation → Markup → Distribution → Markdown cycle. Includes a Daily/Weekly chart toggle for multi-timeframe context, a MTF Alignment badge showing whether daily and weekly phases agree, a Cycle Position indicator (Early/Late Accumulation, Markup, etc.), and a clickable Scoring Breakdown — tap any scoring row to see the formula, thresholds, and live values for that stock.
Sequential Exhaustion (9-13)
Rule-based reversal timing
A fully objective, no-judgement timing tool that counts how mature a trend is. A 9-bar Setup measures momentum exhaustion, then a 13-bar Countdown pinpoints the likely turning point. A buy sequence flags a maturing downtrend (a potential bottom — bullish reversal); a sell sequence flags a maturing uptrend (a potential top — bearish reversal). Adds setup "perfection", dynamic range support/resistance, an objective stop level derived from price (not a fixed %), a daily↔weekly alignment check, and a confirming 9-13-9 flag. A faster sibling, Fast Exhaustion (13), counts straight from the setup and confirms in as few as 13 bars with a stricter test — and when both counts complete in the same direction you get a Double Exhaustion, the highest-conviction reversal read in the suite. An Early Exhaustion (13) sub-track runs ahead of the Sequential count, qualifying each bar by its low/high instead of its close so it flags the trend extreme earlier — a leading heads-up that the Sequential count then confirms. A Reversal Read interpretation layer goes one step further: it flags whether a completed count shows Trend Extension (the move pushed beyond the prior range and may run further) or Consolidation bias, marks a Confirmation Level that turns the read into a Confirmed Reversal once price closes back beyond it, and watches for a momentum Price Flip in the new direction. Pairs naturally with Wyckoff and AMD for context.
Backtesting Dashboard
Does this signal actually work? Now you can check.
Walk-forward, look-ahead-free backtesting of every chart pattern, candlestick pattern, and Sequential Exhaustion (TD) signal. Each signal type reports a sample count, direction-aware win rate, average forward returns (5/10/20-day), max favorable vs adverse excursion, and TP→SL hit rate — so you know which signals have a real edge on IDX before you trade them. A hypothetical equity curve adds Sharpe, max drawdown, CAGR, and profit factor. Run it on any ticker live, or open the Market-Wide view for aggregate stats pooled across the universe. Built on a pluggable signal engine, so new indicators are backtested automatically.
Volume Profile
Price-volume distribution & value area
Maps how much volume traded at each price level, revealing where the market spent the most time. The Point of Control (POC) marks the fairest price where most activity occurred. The Value Area (VAH–VAL) contains 70% of trading volume — price outside this range tends to revert to it. Auto-anchors to the nearest significant swing point for dynamic, context-aware analysis.
Initial Balance
Daily, weekly & monthly opening range
Defines the opening range's high (IBH) and low (IBL) across three timeframes — the Daily session, the first day of the Week, and the first week of the Month. A confirmed close above IBH signals bullish conviction; below IBL, bearish. Extensions at 1× and 2× the IB range give calibrated targets, and a cross-timeframe IB Alignment read flags broad-based breakouts where daily, weekly and monthly all agree. View it as a Levels panel or a TradingView-style Chart that traces continuous IB high/low lines with targets and break markers.

Sample output: Weekly Initial Balance Chart view — continuous IBH/IBL lines tracking each week's range, breakout arrows, and a live-forming period
AMD Analysis
Accumulation, Manipulation & Distribution cycle detection
Identifies where price is in the Smart Money Concepts (SMC) AMD cycle. Accumulation marks the consolidation range where institutions build positions. Manipulation is the engineered liquidity sweep — a false breakout that triggers retail stop-losses. Distribution is the true directional move confirmed by FVG, OB, BOS, and CHoCH. The AMD card is organised into three tabs: Overview (scores, chart, factors), SMC Signals (FVG/OB/sweep chips with price labels, Fibonacci zone badge, weekly alignment), and Trade Setup — which auto-generates an entry zone, stop-loss, two profit targets, and risk/reward ratio when sweep + OB/FVG + Fibonacci zone confluence is detected.
Anchored VWAP
Institutional fair value basis & dynamic support/resistance
Anchors the Volume Weighted Average Price (VWAP) to significant price events — swing highs, swing lows, earnings releases, or major news catalysts — to reveal where institutional players established their positions. Unlike standard VWAP that resets daily, Anchored VWAP persists from the chosen anchor point and acts as dynamic support in uptrends or resistance in downtrends. Price trading above Anchored VWAP suggests institutional buyers are in profit (bullish); price below indicates they are underwater (bearish). Auto-anchors to the most significant swing detected in the analysis window. Standard deviations (+1σ, +2σ, –1σ, –2σ) provide volatility bands for mean reversion setups. View it as a Levels table or a TradingView-style Chart tracing the running VWAP line with its ±1σ/±2σ bands from the anchor, with fullscreen mode.
Rolling VWAP
Trailing fair value over a window you choose — 1M, 3M, or 1Y
Where Anchored VWAP fixes to a single event, Rolling VWAP tracks the volume-weighted average price over a continuously trailing window — 1 month, 3 months, or 1 year — so you always see the cost basis of recent participants, not a months-old anchor. Each window carries ±1σ and ±2σ deviation bands that frame five zones: stretched above (+2σ), strong (+1σ), fair value (≈VWAP), value (−1σ), and oversold (−2σ). The Smart Money Screener carries a matching "VWAP Band" filter built on the 1-year window, so you can scan the whole market for, say, every stock sitting in its yearly value zone. It pairs directly with Relative Strength in the "Leaders at Value" signal — market leaders pulling back to fair value rather than chasing extended moves. New listings without a full year of history are tagged and excluded until enough data accrues. Each window can also be viewed as a chart — the rolling VWAP line and its bands drawn over the candles, with fullscreen mode.

Sample output: Rolling VWAP Chart view (3-month window) — VWAP and moving-average lines drawn over the candles, with the anchor bar marked
Price Line Statistics
Close, moving averages, and VWAP on one chart — with a Mean Reversion Score
Plots Close alongside MA20, MA50, and both Quarterly (63-bar) and Yearly (252-bar) rolling VWAP on a single one-year chart, so you can see at a glance whether price is stretched from its short-term trend or sitting far from where volume has actually transacted. Beneath the chart, a composite Mean Reversion Score (0–100) distills five statistical measures — distance from the 52-week high, price percentile rank within the last year, z-scores against both the Quarterly and Yearly VWAP, and RSI(14) — into one number: higher means more statistically oversold (mean-reversion potential), lower means more overbought. It's a statistical tendency, not a signal on its own — pair it with Wyckoff phase and trend context before acting. Pro only.
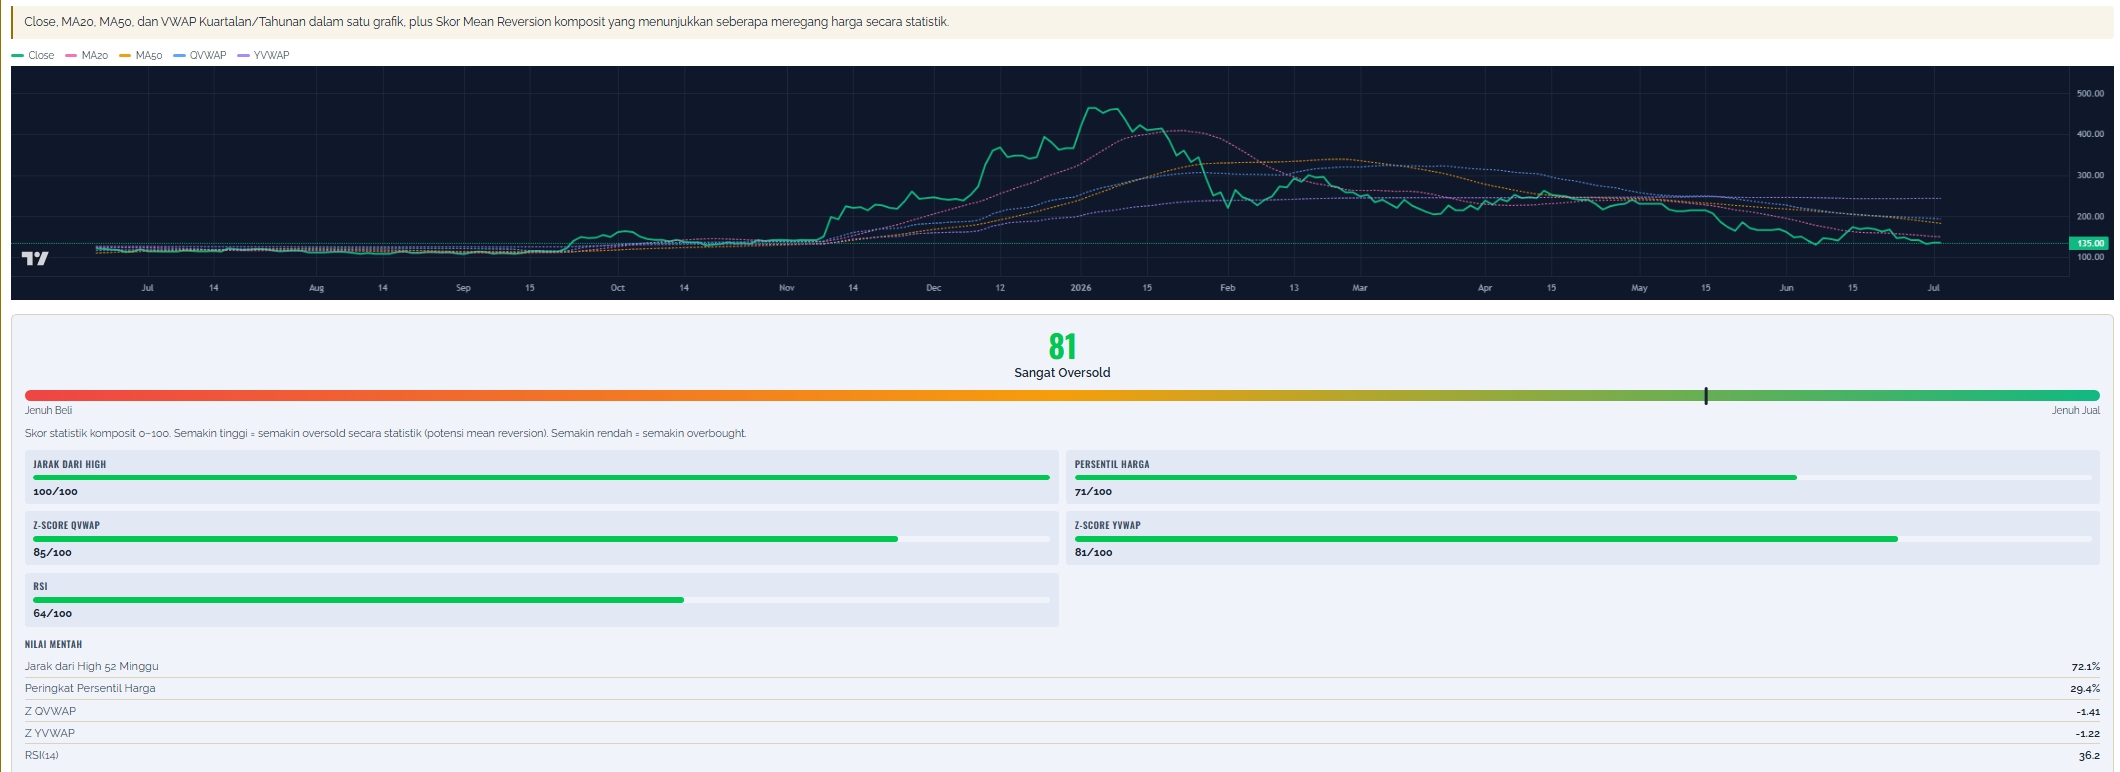
Sample output: Close, MA20, MA50 and Quarterly/Yearly VWAP on one chart, plus a composite Mean Reversion Score breaking down each sub-component
View Chart
Always-on chart, 27 indicators toggled like TradingView, Daily/Weekly/Monthly, EMA Cloud and Smart Money overlays — shareable as a live embed
A chart shown by default for every analyzed stock — no click needed — in seven chart types (candles, hollow candles, bars, line, area, baseline or Heikin Ashi), that overlays every indicator VolaraID computes — Volume, Moving Averages (20/50/200), Anchored VWAP with ±1σ bands, Bollinger Bands, ATR, Realized Volatility, the RS Line vs IHSG, Initial Balance (weekly/monthly), Wyckoff event markers, AMD/SMC zones, the full Volume Profile distribution as a histogram (horizontal bars growing leftward from the price axis, one per price bin, POC in gold and value-area bins emphasised, with a Buy/Sell mode that splits each level into estimated buying and selling), the five Smart Money overlays drawn straight onto the candles (Fair Value Gaps, Order Blocks, Premium/Discount zones, Liquidity Pools and BOS/CHoCH levels), and Accumulation Intensity (a volume-weighted read of where each bar's close landed in its own range, above zero for buyers closing it and below for sellers — plus a Pressure setting that grades each day's smoothed buying or selling pressure into five Demand and five Supply levels, with IDX limit-locked ARA/ARB days that moved 10% or more drawn at full strength; a description of recent trading, not a forecast), a 9/21 EMA Cloud whose fill turns green or red as short-term momentum changes hands and which recomputes on whichever timeframe you’re viewing, and quarterly Revenue Growth markers placed on the day results were actually announced rather than the day the quarter ended — each one a checkbox you switch on or off, exactly like a TradingView indicator list. By default only Volume and MA20/MA50 are shown; everything else loads on demand the first time you enable it. A TradingView-style legend in the chart's top-left corner shows the ticker, its sector-rotation state, and live values for every active indicator, updating as you hover. The header’s right side keeps RSI(14) and the MACD histogram permanently in view — each labelled Overbought/Oversold or Bullish/Bearish — so you can read momentum without leaving the chart. Up to four indicator panels stack at the bottom as real chart panels — each with its own price axis and a live value in its label — which you can drag to resize, reorder with the arrows in the indicator list, and which stay as you left them — as do each indicator’s own settings, such as Pressure or a weekly Initial Balance. A native Fibonacci tool lets you click two points on the chart to draw your own retracement, replacing the old auto-computed swing-based levels. The same Draw menu adds a persisted Trend Line and Rectangle — placed with two clicks, saved on your device so they're still there next time you open the ticker, surviving a Daily/Weekly/Monthly switch, and carried into the shared PNG. Below the checklist, a sector-rotation panel shows the stock's sector on the JdK RRG quadrant (Leading/Weakening/Lagging/Improving) with its 7-week trail, plus the stock's rank by RS-Ratio among its sector peers. On a wide enough screen the chart moves beside the Summary/Signals/Structure/Financials tabs instead of above them, with a draggable divider between the two — drag it once and your split stays put on every future visit. On a shorter or narrower screen the chart simply scrolls with the page instead of staying pinned, so it never squeezes the reading room below it. TradingView-style controls sit beneath it: log, percentage and indexed price scales, range presets from 1M to All (up to 10 years of history, loaded on demand), an OHLC legend for the bar under your cursor, and keyboard shortcuts to scroll, zoom and reset the view. The chart follows your light/dark theme and opens full-screen with one click. And when you want to show someone what you are looking at, Share downloads the chart exactly as it stands — timeframe, every indicator you switched on, every variant — as a Volara-branded PNG, with a labelled chip under the chart for each active indicator giving its name, its colour and its latest value. It drops straight into WhatsApp, a Telegram group or a slide, with nothing to host and nothing to expire. Beside it, Embed gives you the same chart as a public link and a ready-made iframe snippet instead — for a blog post or a Notion page, where the reader can pan, zoom and hover rather than squint at an image. Embedded charts are frozen snapshots of the moment you shared them, so a link posted with a caption never stops matching it, and you can revoke one at any time. On a desktop-width screen, a Replay button steps backward through the ticker's history bar by bar, showing the Wyckoff phase, AMD phase, TD Sequential count and Order Block/BOS/CHoCH markers exactly as the engine could have known them on that date — never today's read painted onto the past. Pro only.
Relative Strength & Leaders at Value
Who is leading the market — and where to buy them
An IBD-style Relative Strength Rating ranks every IDX stock's trailing ~12-month price performance against the whole market on a 1–99 scale — the cross-market percentile a single chart can't compute (80+ marks a true market leader). Because VolaraID scans the entire market each night, it also tracks how that rank is moving: 1-month and 3-month RS trend arrows reveal whether leadership is being built (▲) or fading (▼), and an "RS Accelerating" preset isolates names whose rating jumped fast. The headline signal pairs strength with price: Leaders at Value surfaces RS leaders that have pulled back into their 1-year Rolling VWAP value zone — leadership meeting a value entry rather than an extended chase — across the screener, Market Highlights, and Top Picks scoring. The RS Line (price ÷ IHSG) plots outperformance directly, flagging a new high before price as emerging leadership.
Thematic Beta — What This Stock Moves With
IDX is unusually theme-driven. Now you can see which theme owns your stock
Someone holding ADRO, PTBA and ITMG together has one bet, not three — but nothing on a single chart tells you that. Every IDX stock is nightly-matched to a theme (Thermal Coal, Palm Oil, Nickel, Gold, Banks, and dozens more, hand-corrected where Yahoo's own classification lumps nickel, gold and tin into one meaningless bucket) and measured against an equal-weight basket of its theme peers — with the stock always excluded from its own basket, so the number is never inflated by measuring something against itself. The result is a beta (how hard it moves with the theme) alongside its correlation (how reliable that relationship actually is — a beta without a decent fit is noise, not leverage), the same read against IHSG, and a percentile rank within the theme's own cohort. The standout finding: a stock can secretly track a DIFFERENT theme harder than its own — flagged only when the fit is both strong and clearly better than home, so a hotel operator is never told it "tracks tech" on a coincidence. Built from real IDX price history, not commodity futures — which measures the Indonesian trade (DMO, royalties, HBA) more faithfully than an overseas benchmark ever could.
Market Themes — Which Theme Is Actually Leading
Thematic Beta tells you which theme owns a stock. Market Themes tells you which theme is winning today
A Research board rolling every ticker's Thematic Beta read up to the theme level: 13 curated IDX themes (Coal, Coal Services, Nickel, Gold, Palm Oil, Oil & Gas, Shipping, Big Banks, Digital Banks, Cement, Tobacco, Property, State Construction), each one measured — not asserted — against a same-size random-basket baseline before it ever shipped, so a theme on the board is a real, cohesive basket rather than a label of convenience. Every theme carries excess return vs. IHSG across 7 windows (1D through 1Y + YTD), a cohesion score with its own tier, breadth (advancing/declining, % above MA50), a compounding theme index, and ranked leaders/laggards you can drill into by ticker. A companion Relative Rotation Graph plots each curated theme's rotation quadrant (leading/weakening/lagging/improving) with a 7-session trail, so a rotation out of one theme into another is visible before it's obvious in any single stock's chart. Now wired into the Smart Money Screener too — filter or sort the whole 800+ universe by theme.
Foreign Flow Divergence
Reading the shape of foreign buying against price, per ticker
The Top Accumulators leaderboard becomes a per-ticker signal: a divergence score built from up to 60 days of foreign-flow snapshots compares a turnover-normalized flow intensity against price movement over the same window, alongside a flow z-score and a buy/sell streak with hit-rate. Four states fall out — stealth accumulation (foreign buying while price sits flat), distribution into strength (foreign selling into a rising price), and their two "aligned" cousins. It surfaces as a sortable/filterable Screener column with matching presets, a Foreign Flow card on the Analyze page (state badge, stats, cumulative-flow-vs-price sparkline), and two Market Highlights leaderboards. Signals start at 20 days of coverage and sharpen toward 60 — and since net foreign value is a vendor-side estimate, every surface says so plainly.
Buying Pressure Detector
Where unusual buying is landing today — and whether it's real money
A daily market-wide board that ranks the stocks trading on unusual buying volume — an up-close day, settling in the upper half of its range, on 1.5×+ its average volume — and overlays each name's traded rupiah value today. That overlay is the whole point: a stock spiking to 8× its normal volume on only a few hundred million rupiah is thin retail churn, while one on 3× its volume but Rp150B of turnover is real institutional buying. Green bars read against the left "×" axis, the blue value line against the right axis, and a table underneath adds today's value versus its 20-day norm, the day's change, and net foreign lots.
Volatility Pack
How tight is the range right now — and is it about to move?
A Compression Score (0-100) blends Bollinger-band-width percentile against the stock's own trailing history with a TTM squeeze (Bollinger bands fully inside Keltner Channels) and an NR7 narrowest-range flag — the tighter the range, the higher the score. A Volatility Regime reads 20-day realized volatility and its own percentile to classify the stock as expanding, contracting, or stable. Surfaces as a sortable/filterable Screener column plus a "Coiled Spring" preset (compressed AND at a monthly Initial Balance breakout), a Volatility Pack card on the Analyze page's Signals tab, and a Market Highlights leaderboard. The same math also upgrades Top Picks' Monte Carlo trade-probability sigma from a flat 60-day realized volatility to a RiskMetrics EWMA (λ=0.94) estimate that reacts to recent volatility clustering.
Liquidity / Tradability Pack
How tradable is this stock, really?
Amihud illiquidity (20d/60d) shows the price impact per billion Rupiah traded — the canonical academic price-impact proxy, now on every ticker. An abnormal-volume z-score flags today's volume against its own trailing baseline, and an interactive "days to exit" calculator on the Analyze card shows how long it would take to unwind a position at a given daily-value participation rate. A registry-derived free-float turnover ratio and an approximate ARA/ARB (auto-rejection) limit-hit history round out the picture — frequent hits are a documented "gorengan" signature and now also feed the Manipulation Risk Score as an 8th factor. Surfaces as sortable/filterable Screener columns with "Liquid & Tradable" and "Gorengan Watch" presets, a Liquidity Pack card on the Analyze page's Signals tab, and a Market Highlights leaderboard. ARA/ARB detection is an EOD-close approximation on main-board price bands only (effective 2025-04-08) — a risk flag, not proof of manipulation.
Smart Money Screener
Self-describing presets & real-time market scan
Scans 800+ IDX stocks daily and ranks each with a 0–100 Conviction Score. 31 pre-built presets cover Smart Money Buy, Distribution, Oversold, High Volume, Supply & Demand Exhaustion, Spring Candidates, Bullish Pattern Setup, Reversal Candle Hunters, Sequential Exhaustion, IB Breakout, RS Leaders, the Smart Setups family (VCP, Trend Template, Smart Money Before Rally, Uptrend Pullback, Bullish Harami+), and the new Resistance Breakout (swing high / SMA50 / 1Y VWAP / gap) and Fresh Demand Zone (bullish Order Block / Fair Value Gap) scans. Every preset now explains itself before you click it — hover for a one-line description of exactly what it screens for, or open the ⓘ beside its name for the full explanation alongside its measured historical edge; once applied, that description stays on screen above the results, so what produced the current list is always visible. Every preset's real-world performance is now tracked with a forward (out-of-sample) test — each match is logged the moment its signal fires, before anyone knows what happens next, and its actual outcome is followed over the following weeks. Nothing is recomputed after the fact and nothing is ever quietly removed, so the evidence builds honestly over time rather than being shaped by hindsight. Filter by Wyckoff phase & sub-phase (A–E), AMD signals, rating, sector, RSI, relative volume, weekly change, relative strength vs IHSG, a minimum transaction-value (liquidity) floor that screens out thin names, Volume Profile position, chart & candlestick patterns, breakout & demand zones, and a Max Pump Risk safety gate. Sortable columns include Conviction, Combined Score, Weekly Δ, RS vs IHSG, absorption, Pump Risk, and detected chart & candle patterns. Results update automatically after the EOD scan.
Market Insights
Foreign flow, top accumulators, sector & conglomerate rotation, market highlights — daily
Six daily intelligence feeds in one tab: Foreign Flow aggregates net buy/sell data for all 861+ IDX tickers with IDR value, sector heatmap, anomaly badges, and top-10 movers; Top Accumulators (Pro) surfaces tickers with consistent 20-day net foreign buying passing 3 stealth-accumulation criteria — cumulative net positive, no heavy distribution day, and volume confirmation ≥ 1.2×, ranked by total IDR inflow with per-day sparklines; Sector Rotation plots 11 IHSG sectors on a live RRG chart using the JdK RS-Ratio/Momentum algorithm — click any sector dot to drill down into its top 10 tickers; Conglomerate Rotation applies the same RRG to 15 Indonesian conglomerate groups (Salim, Astra, Sinar Mas, Djarum, and more), with the same drill-down; Market Highlights delivers 19 weekly signal categories — including the new Foreign Divergence and Distribution Alert — with a free tier plus deeper Pro-only categories; and Top Picks surfaces the 5 highest-probability algorithmic trade candidates daily.
Corporate Actions & Dividend Intelligence
Dividend calendar, yield & payout history, and ex-date price behaviour — free
Synced nightly from KSEI's official corporate-action schedules: a Corporate Actions calendar (cash dividends, RUPS, rights issues, stock splits) and a Dividends view with trailing yield, all filterable by date range in Research → Insights. Every ticker's Analyze page gets a Dividend Intelligence card: TTM yield, consecutive payout-year streak, 3-year DPS growth (CAGR), the next known ex-date, a per-year dividend history chart, and Dividend Capture statistics — how much the price actually dropped around each past ex-date versus the dividend amount, and how long it typically took to recover, computed from raw (unadjusted) price history so the real ex-date move isn't smoothed away. The Screener gets a sortable/filterable Dividend Yield column and a "Dividend Payers" preset (yield ≥4%, streak ≥3 years). IPO lock-up expiry dates (estimated — 8 months from listing per POJK 25/2017) also now feed the Manipulation Risk Score as a 9th factor. Everything on this page is free for every tier.
Market Breadth & Regime
Market-wide internals — advance/decline, McClellan momentum, and a Risk On / Risk Off regime read
Every night VolaraID aggregates the whole IDX scan universe into market internals: advancing vs declining vs unchanged counts, new highs vs new lows (with a coverage note when many listings are younger than 52 weeks), up-volume vs down-volume, and the % of stocks above their MA20/50/200. A market regime badge distills it into Risk On / Neutral / Risk Off with a 0–100 score and plain-language reasons — including a volatility guard that downgrades Risk-On to Neutral when IHSG realized volatility runs in the top tercile of its trailing year — plus a 120-session color strip showing how the regime has evolved. Three history charts read the trend: the cumulative Advance/Decline line vs IHSG (divergence = the index is being carried by fewer and fewer stocks), the McClellan Oscillator + Summation Index (breadth momentum), and % of the universe above MA20/50/200. A Zweig Breadth Thrust detector flags the rare washout-to-surge signal that has historically preceded major rallies, TRIN checks whether volume confirms the count, Median Stock vs IHSG exposes narrow rallies carried by a few big caps, 90% volume days mark thrust buying and capitulation selling, an automatic A/D divergence detector warns when an index high lacks participation, and the New Highs/Lows stat now carries an IDX-validated NH/NL ratio (22-day forward-return IC significant at p<0.01 on ~4 years of history) — with a plain-language insight line under every statistic. A Sector Breadth panel breaks the same internals down across all 11 sectors — advance/decline, % above MA50, and net new highs per sector, sortable and click-through to that sector's RRG ranking. Two new Sector Activity charts show where the money is moving today: relative volume vs each sector's own 20-day baseline plus its total transaction value, and a value-weighted sector return leaderboard (Σ value×change% ÷ Σ value) that surfaces which sector's move was actually backed by rupiah, not just headcount. Free users see today's pulse (A/D counts + regime state) and a compact regime chip in the status bar on every page; the full dashboard including Sector Breadth and Sector Activity is Pro.
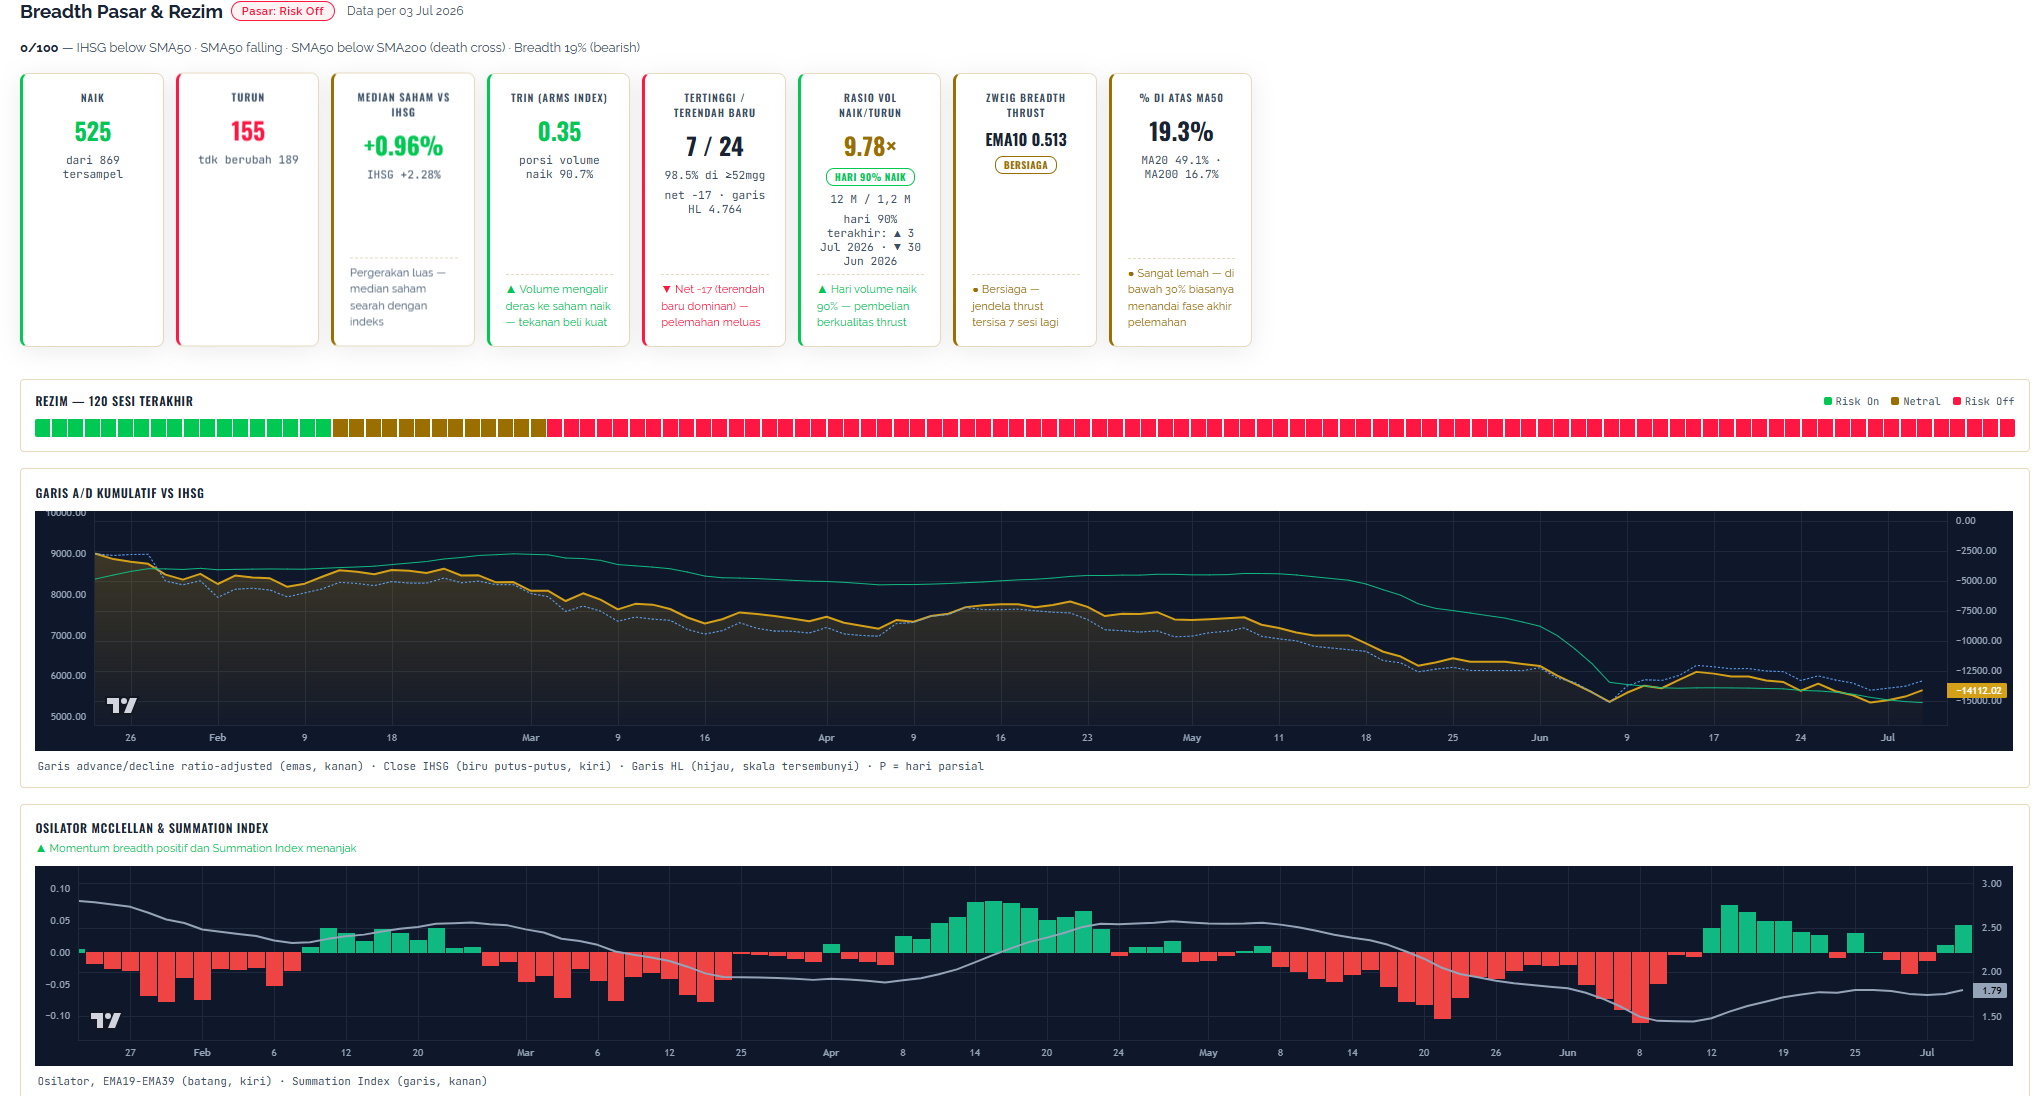
Sample output: Risk Off regime (0/100) — IHSG below SMA50, SMA50 falling, death cross, 19% breadth — with a 90% Up Volume Day flagging quality buying against the downtrend
Market Highlights
19 weekly categories — Top movers, smart money signals, foreign flow divergence
Market Highlights provides a weekly market summary with 19 curated signal categories, using the past 5 trading days of data. Each category is algorithmically generated to surface the most actionable opportunities across the entire IDX market — weekly top gainers/losers, unusual volume spikes, smart money signals (Wyckoff Spring/SOS/Absorption — exclusive to Pro subscribers), sector leaders by combined score, near-breakout candidates (within 2% of VAH), oversold reversals (RSI ≤35 + Accumulation — exclusive to Pro subscribers), top fundamental value stocks, weekly relative strength leaders/laggards vs IHSG, foreign flow stealth accumulation and distribution alerts per ticker (Pro), and the most actively traded tickers. A free tier covers the core categories, with the deeper smart-money and foreign-flow signals reserved for Pro — your weekly discovery layer before deep analysis.
Financial Report Intelligence
Upload an OJK PDF (up to 200 pages, 5/day) — YoY growth, 30+ risk flags, 4 advanced analytics. Text PDFs ~1 min · scanned PDFs up to ~10 min with auto OCR
Speed: ~30–60 sec for text PDFs · up to ~10 min for scanned PDFs (OCR cached per file). Limits: 5 reports/day on Pro. Privacy: Every PDF is deleted immediately after extraction — no content is stored.
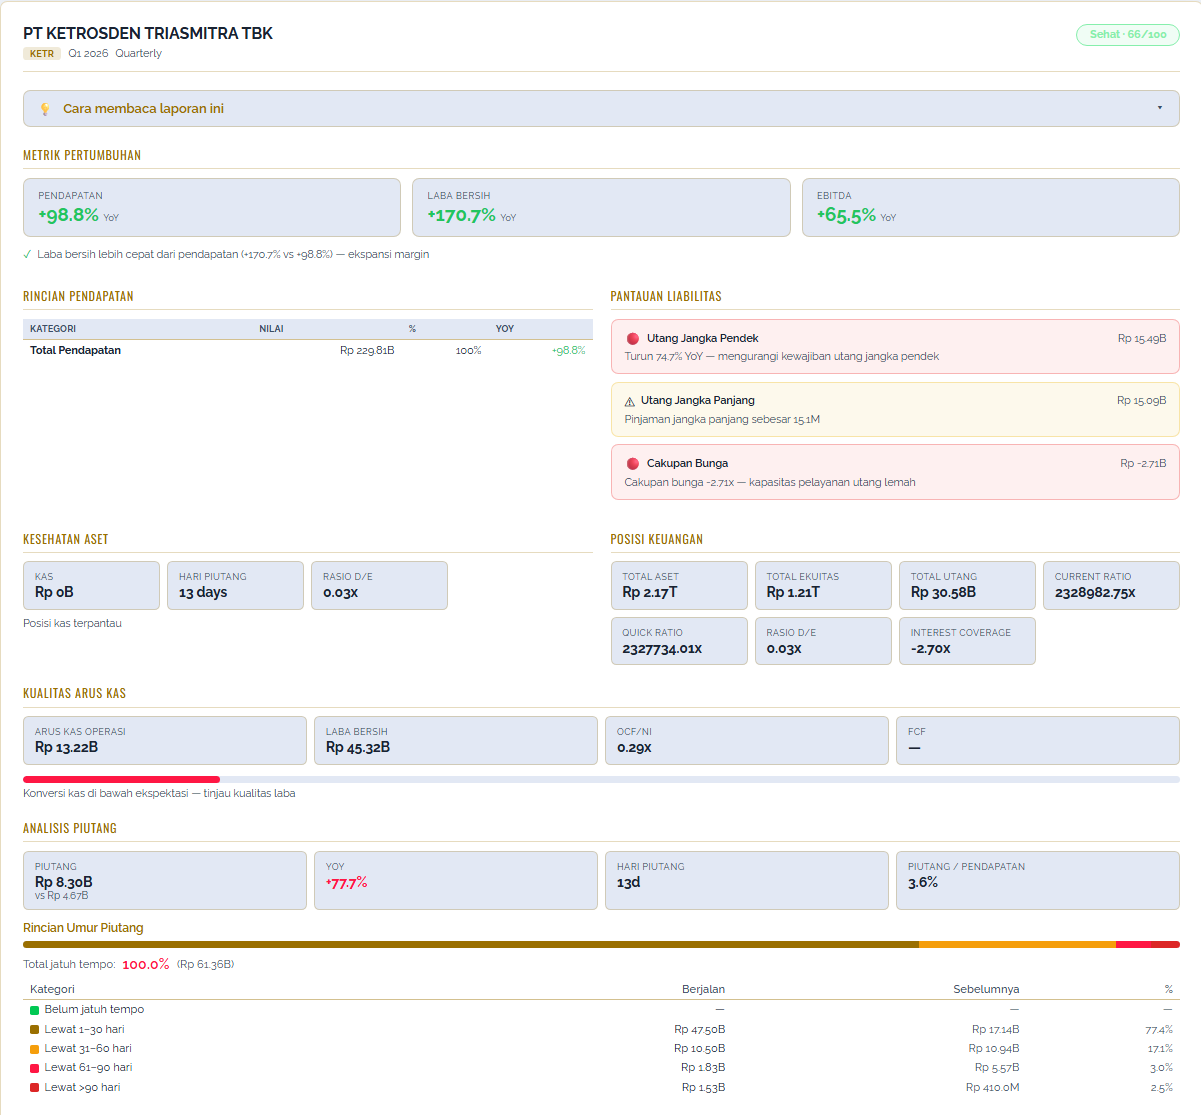
Sample output: FRI analysis — Piotroski F-Score · Altman Z''-Score · DuPont ROE decomposition · 30+ risk flags · 0–100 composite verdict
Chart & Candlestick Pattern Recognition
Algorithmic detection — 13 chart patterns · 20 candlestick signals · confidence scoring
Detects 13 classic chart patterns — Cup with Handle, Double Top/Bottom, Head & Shoulders, Ascending/Descending/Symmetrical Triangles, Bull/Bear Flags, Falling/Rising Wedges, and Rounding Bottom — using pivot-point geometry and scipy.signal.find_peaks. Also detects 20 candlestick patterns (Hammer, Engulfing, Morning/Evening Star, Doji variants, Three White Soldiers/Black Crows, Rickshaw Man, and more) using body/wick ratio analysis with prior-trend context gates. Each detected pattern comes with a 4-component confidence score, measured-move target price, stop-loss level, and a dedicated interactive chart zoomed to the pattern window with numbered pivot labels and trendlines drawn over real OHLCV data. Available on the Analyze page, as optional Screener columns, and as two new Market Highlights categories.
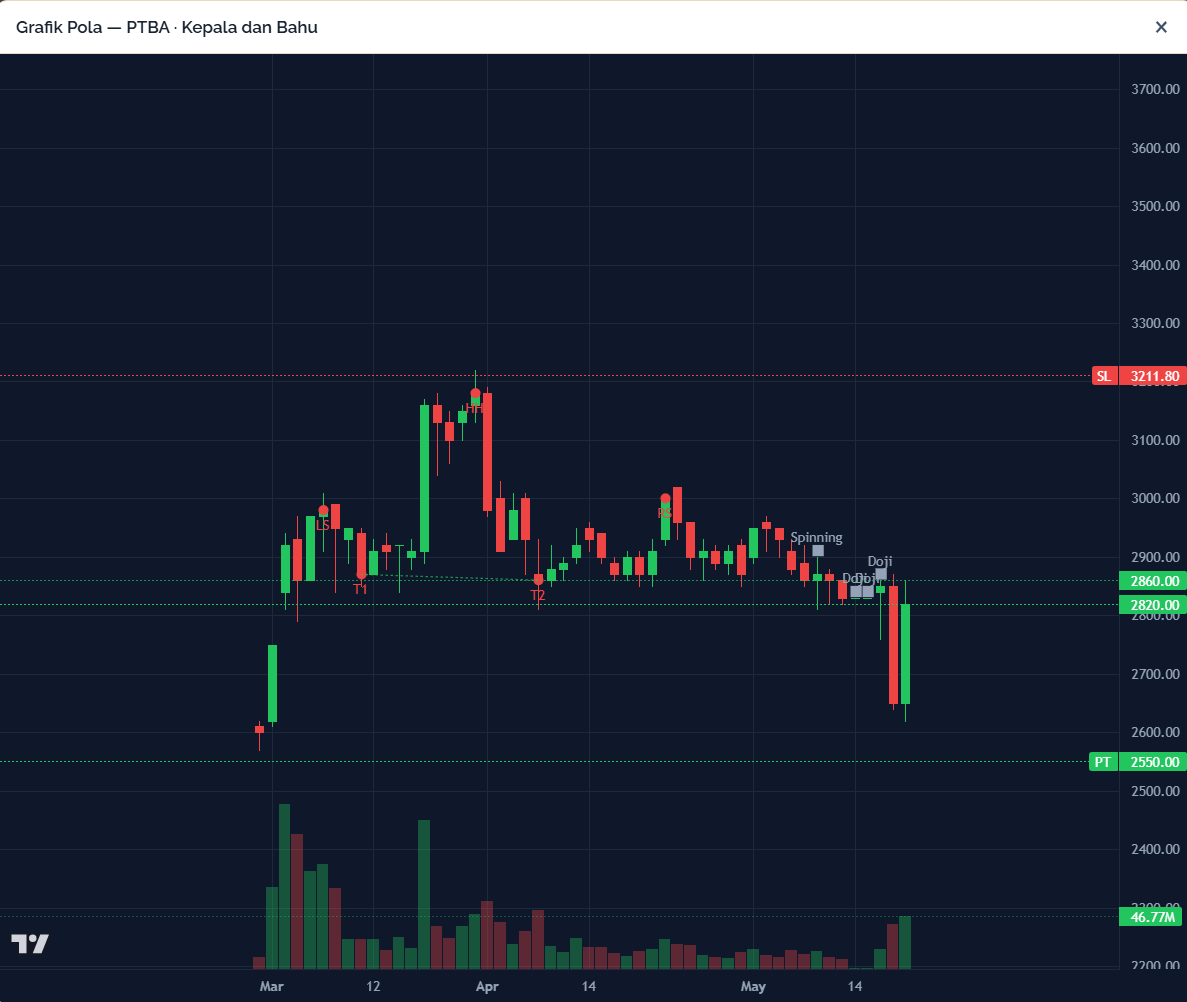
Sample output: Head & Shoulders detected — neckline + numbered pivots · measured-move target & stop · confidence score · volume bars
Stock Comparison
Side-by-side multi-metric comparison for 2–4 IDX tickers
Stock Comparison lets you place up to 4 IDX tickers side-by-side and evaluate them across 31 pre-computed metrics spanning 8 groups: Wyckoff (daily phase, weekly phase, D/W alignment), Rating (combined score, conviction, manipulation risk tier), Price (close, 20-day return, YTD return, market cap), Technical (foreign flow 5-day & 20-day net, Anchored VWAP alignment), Fundamentals (P/E, P/B, ROE, D/E ratio), AMD/SMC (AMD zone, SMC BOS direction, CHoCH direction, active FVG count), Sequential Exhaustion (9-13 signal, setup count, countdown count), and Risk (manipulation risk tier). Each metric row highlights the "winner" ticker in green. Save named comparison sets (e.g. "Bank Big-4", "Conglomerate Watch") for one-click recall. Pro-only feature.

Sample output: 4 tickers side-by-side across Wyckoff, rating & score, price & returns, technical, and fundamentals — a per-column wins tally crowns the overall leader, in-cell bars rank each row at a glance, and the metric winner is highlighted in green
Customizable Analyze Desk
Drag, reorder, hide, and resize every Analyze section into your own layout
Every subtab in Analyze (Summary, Signals, Structure, Financials) becomes its own drag-and-drop desk. Click "Customize Desk" to enter edit mode, then drag any section by its header to reorder it, hide the ones you don't use from the Add Widget tray, and switch between 1/2/3-column layouts per subtab — the Signals tab alone holds 11 independent widgets (Fibonacci, Anchored & Rolling VWAP, Price Line Statistics, Initial Balance, Relative Strength, Foreign Flow, Volatility, Liquidity, Chart Patterns, and the core signals grid), so this is where a 2- or 3-column layout pays off most. Your layout is saved to your account and follows you across devices, with a one-click Reset back to the default order. Desk customization is desktop-only — smaller screens and free-tier accounts always see the standard fixed layout. Pro-only feature.
Plans
| Free | Pro ★ | |
|---|---|---|
| Stock Analysis | Up to 5 tickers | Unlimited tickers |
| Technical + Fundamental | ✓ | ✓ |
| Wyckoff Analysis | — | ✓ Daily + Weekly MTF |
| Volume Profile | — | ✓ |
| AMD Analysis + SMC | — | ✓ |
| Anchored VWAP | — | ✓ |
| Rolling VWAP | — | ✓ 1M / 3M / 1Y · Screener VWAP Band |
| Price Line Statistics | — | ✓ Mean Reversion Score 0–100 |
| Relative Strength (RS) | — | ✓ RS Rating 1–99 + trend · RS Line · Leaders at Value |
| Thematic Beta | — | ✓ Beta/correlation vs. theme & IHSG · theme rank · cross-theme flag |
| Market Themes | — | ✓ 13 curated theme board · leaders/laggards · Theme RRG · screener filter |
| Foreign Flow Divergence | — | ✓ Divergence score −100..+100 · flow z-score · buy/sell streak |
| Volatility Pack | — | ✓ Compression Score · TTM squeeze/NR7 · volatility regime |
| Liquidity / Tradability Pack | — | ✓ Amihud illiquidity · days-to-exit · ARA/ARB history |
| Stock Prediction | — | ✓ |
| Smart Money Screener | — | ✓ |
| Market Insights | ✓ Market Highlights + Foreign Flow + Breadth pulse | ✓ Full suite + RRG Rotation (Sector + Conglomerate) + Market Breadth & Regime (TRIN, Zweig Thrust, A/D divergence, Sector Breadth, Sector Activity) |
| Today's Top Picks | ✓ Daily teaser | ✓ Daily algo candidates |
| Watchlist | 1 list | Multiple lists |
| Shareholders Intel | ✓ 1% basic view | ✓ + Pro add-on available |
| Financial Report Intelligence | — | ✓ 5 reports/day, 200 pages, auto OCR |
| Chart & Candlestick Patterns | — | ✓ 13 chart + 20 candle · Screener filters & Market Highlights |
| Sequential Exhaustion (9-13) | — | ✓ Rule-based reversal timing · Fast Exhaustion (13) & Double Exhaustion · Screener preset & column · Market Highlights |
| Stock Comparison | — | ✓ 2–4 tickers · 31 metrics · correlation matrix · saved sets |
| Top Picks Track Record | ✓ Full public record — no login | ✓ + Full pick-by-pick history drill-down |
| Backtesting Dashboard | — | ✓ Pattern / candle / TD edge stats · equity curve · market-wide |
| Customizable Analyze Desk | — | ✓ Drag-reorder · hide/show · 1–3 columns · synced across devices |
| Export Results | — | ✓ CSV / PDF |
- Up to 5 tickers per run
- Technical Analysis (RSI, MACD, EMA)
- Fundamental Analysis
- Summary table & ratings
- Watchlist (1 list)
- 📊 Market Highlights (11 categories)
- 🏛️ Shareholders 1% basic view
- Stock Prediction
- Smart Money Screener
- Wyckoff Analysis
- Volume Profile
- Initial Balance
- AMD Analysis
- Anchored VWAP
- Rolling VWAP
- Price Line Statistics
- Relative Strength (RS Rating + RS Line)
- Financial Report Intelligence (FRI)
- Chart & Candlestick Pattern Recognition
- Stock Comparison
- + Shareholders Pro add-on available
- Everything in Free
- Unlimited tickers per run
- 🔮 Stock Prediction
- 📉 Wyckoff Analysis
- 📊 Volume Profile
- ⚖️ Initial Balance
- 🎯 AMD Analysis
- ⚓ Anchored VWAP
- 🌀 Rolling VWAP (1M / 3M / 1Y) — Screener VWAP Band filter
- 📏 Price Line Statistics — Close/MA/VWAP chart & Mean Reversion Score
- 🚀 Relative Strength — RS Rating (1–99) + trend, RS Line & Leaders at Value
- 🕵️ Foreign Flow Divergence — stealth accumulation & distribution alerts, per ticker
- 🌀 Volatility Pack — Compression Score, TTM squeeze/NR7, volatility regime
- 💧 Liquidity Pack — Amihud illiquidity, days-to-exit calculator, ARA/ARB history
- 🔍 Smart Money Screener
- 📡 Market Insights Pro
- 🌡️ Market Breadth & Regime — A/D, TRIN, McClellan, Zweig Thrust, Risk On/Off regime
- 🎯 Today's Top Picks
- 🏆 Top Picks Track Record — full pick-by-pick history
- 📄 Financial Report Intelligence (FRI) — 5 reports/day, up to 200 pages
- 📐 Chart & Candlestick Pattern Recognition
- ⏱️ Sequential Exhaustion (9-13) — reversal timing, screener preset & Market Highlights
- 🔀 Stock Comparison (2–4 tickers · 31 metrics)
- 🧩 Customizable Analyze Desk — drag-reorder, hide/show, 1–3 columns
- 🧪 Backtesting Dashboard — pattern / candle / TD edge stats & equity curve
- Multiple watchlists
- Export results (CSV / PDF)
- + Shareholders Pro add-on available
- Everything in Free
- 🔮 Stock Prediction
- 📉 Wyckoff Analysis
- 📊 Volume Profile
- ⚖️ Initial Balance
- 🎯 AMD Analysis
- ⚓ Anchored VWAP
- 🌀 Rolling VWAP (1M / 3M / 1Y) — Screener VWAP Band filter
- 📏 Price Line Statistics — Close/MA/VWAP chart & Mean Reversion Score
- 🚀 Relative Strength — RS Rating (1–99) + trend, RS Line & Leaders at Value
- 🕵️ Foreign Flow Divergence — stealth accumulation & distribution alerts, per ticker
- 🌀 Volatility Pack — Compression Score, TTM squeeze/NR7, volatility regime
- 💧 Liquidity Pack — Amihud illiquidity, days-to-exit calculator, ARA/ARB history
- 🔍 Smart Money Screener
- 📡 Market Insights Pro
- 🌡️ Market Breadth & Regime — A/D, TRIN, McClellan, Zweig Thrust, Risk On/Off regime
- 🎯 Today's Top Picks
- 🏆 Top Picks Track Record — full pick-by-pick history
- 📄 Financial Report Intelligence (FRI) — 5 reports/day, up to 200 pages
- 📐 Chart & Candlestick Pattern Recognition
- ⏱️ Sequential Exhaustion (9-13) — reversal timing, screener preset & Market Highlights
- 🔀 Stock Comparison (2–4 tickers · 31 metrics)
- 🧩 Customizable Analyze Desk — drag-reorder, hide/show, 1–3 columns
- 🧪 Backtesting Dashboard — pattern / candle / TD edge stats & equity curve
- Multiple watchlists
- Export results (CSV / PDF)
- 20% annual discount applied
- + Shareholders Pro add-on available